As developers we like to make our websites engaging, and animated features are a great way to make websites pop. When we implement these features and try them out they look great and we move on. But while these effects may work great for us, someone with a less powerful computer or on a mobile device may not be getting the same user experience. We want all our users to have a smooth experience with our websites so how can we make sure our websites perform well for everyone?
Watch how we use Chrome developer tools to find and fix website speed issues.
I took a look at how we can accomplish this using our old website’s homepage, which used some features that animated on scroll as part of its design. These features looked great on my MacBook Pro, but I noticed that on slower computers the frame rate would drop and cause stuttering. To tackle this problem I chose to look at the performance profiler in Chrome’s developer tools.
First I took advantage of the profiler’s throttling tools to make sure I understood where the problems occurred. The throttling tools allow us to simulate a slower CPU or internet connection, and they’re an excellent way to find out how your website performs for users with slower networks or weaker computers. After throttling the CPU to a simulated 6x slowdown and trying to navigate our homepage it was clear that the movement of our animated features was stuttering and inconsistent.
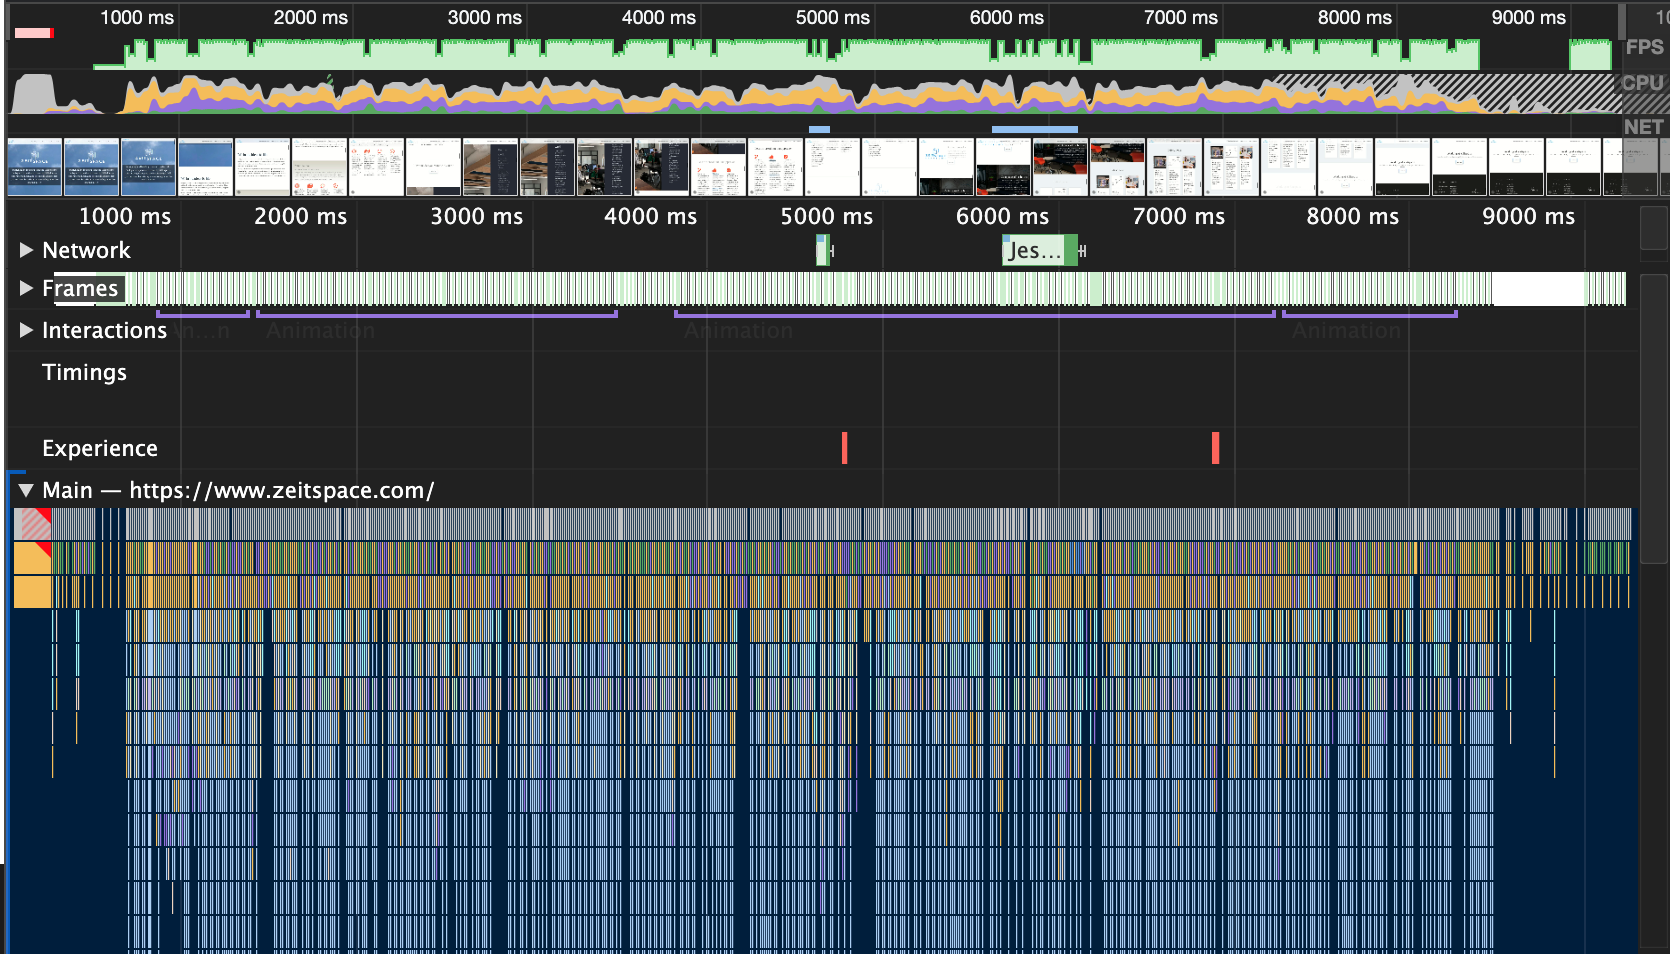
Now that I had a clear view of the problem, I could use the profiling tool to try and diagnose it. I made sure I was working in incognito mode, so that browser plugins wouldn’t interfere with my results, and ran a profile while scrolling through our old homepage. When you finish profiling, Chrome shows you results like this:

This report includes a graph of frame rate and resource usage at the top, followed by screenshots taken throughout the profiling, and then below that a series of timelines for network requests, frame rendering, user interactions, and code execution. We can also select an area of the timeline to zoom in. Let’s take a look at a single frame being run on our old webpage, at 6x CPU slowdown:

We can see that this frame is taking 60.9 milliseconds (ms) to render, giving us a frame rate of 16 frames per second. We can do much better than this. Let's take a closer look at the “Main” timeline:

It looks like the scroll listener function (called “listeningScroll”) in our “ArrowDown” component is calling setState, and that’s taking a fair bit of processing time. The “ArrowDown” component is a small component that shows an arrow at the bottom right of the home page that indicates to the user that there is more content below, and it fades away as the user scrolls down. Let’s take a look at the code and see what’s going on.

Scroll listener and render code for the “ArrowDown” component
Here we see that the opacity of the element is being updated using React’s setState function. While setState is a great way to update content on our page, it has a lot of overhead for making small changes 60 times a second. Instead for an animation like this we should directly edit the styles using JavaScript.

Scroll listener code after our changes
With this change we can run another profile and see how our performance changes:

We’re now doing much less work per frame, and our frame-time has nearly halved from 60 ms down to 36 ms. This is a big improvement, but we could still make more improvements. In the timeline above there are a number of purple elements. These are layout events. We’re only looking at a single frame, so we should only be calculating layout once. Why are there so many events? It turns out we’re running into an issue called forced synchronous layout.
Whenever we change the styles of any element, the web browser needs to recalculate the layout of the page before the next time styles are read. This means that if we update an element’s styles and then read another element’s styles afterwards we force the browser to calculate the page layout an extra time. This recalculation occurs each time we read a style after writing a style. By making this mistake in our animation function we are giving the browser extra work on each frame.
Instead we should read any style value we need (such as an element’s height, width, or opacity) and caching it in a variable at the beginning of the function. This means that after we start writing new values to elements, we won’t trigger a layout calculation because we can simply read the styles we cached earlier.
The performance profiler helps us diagnose these issues. If we select a “Recalculate style” event on the timeline the profiler gives us more details. In the “Call Stacks” section of the summary for the event there are two helpful entries. The “Recalculation Forced” entry points us to the line of code which forced the recalculation by reading a style value after a write. The “Initiator” entry tells us what line of code invalidated the last style calculation by writing a style value.

Performance profiler summary for a “Recalculate style” event
While managing the read and write order is straightforward for a single component, it’s difficult to coordinate this behaviour across multiple components. Here libraries like FastDOM can help us out. FastDOM creates a global “measure” (read) and “mutate” (write) queue. By adding a writing and reading code to the appropriate queue, FastDOM can arrange the instructions so that we perform all our reads first, and then perform all our writes.
We implemented FastDOM in each component that animated on scroll and ran another profile to see what changed:

While the browser’s scroll handler still does its own recalculation we can see that all the layout events from our animation are done together, and at the end of the frame.
While there’s definitely more improvements we could make, especially for scroll-linked effects like we’re using, these are a couple performance issues you can keep an eye out for using the Chrome developer tool’s performance profiler. By taking advantage of performance profiling we can make sure that all our users have a great experience on our website regardless of their hardware.